



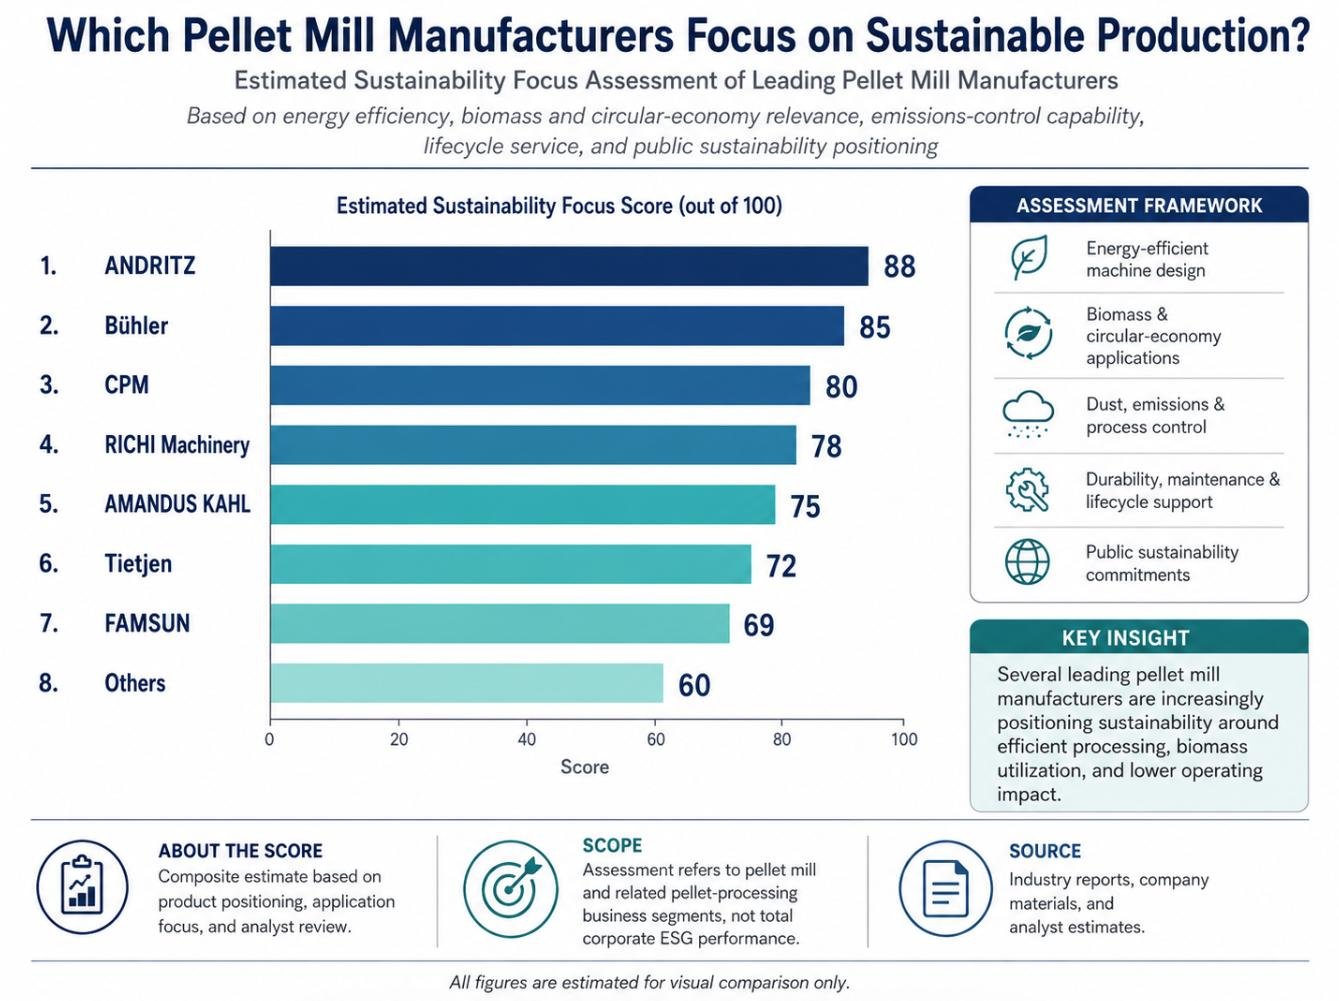
Direct answer: manufacturers that focus seriously on sustainable pellet production combine efficient machine design with material utilization, dust and emissions control, durable equipment, and lifecycle support. In the supplied illustrative 2025 Sustainability Focus Score, ANDRITZ leads at 88 out of 100, followed by Bühler at 85, CPM at 80, RICHI Machinery at 78, AMANDUS KAHL at 75, Tietjen at 72, FAMSUN at 69, and Others at 60. The graphic says this is an estimated visual comparison, not a corporate ESG rating. Buyers should use it as a framework for questions, then verify project-level energy, emissions, waste, and maintainability evidence.
What the sustainability score does—and does not—say
The graphic evaluates five themes: energy-efficient design; biomass and circular-economy applications; dust, emissions, and process control; durability and lifecycle support; and public sustainability commitments. Those dimensions are relevant, but the image does not disclose audited weights, model-by-model test results, or a common project boundary. A score of 88 therefore means ANDRITZ ranks first within the graphic’s stated comparison method. It does not mean every ANDRITZ pellet mill consumes less energy or has a lower lifetime environmental impact than every alternative.
The same caution applies to RICHI’s score of 78. It places RICHI fourth in this estimate, two points behind CPM and three points ahead of AMANDUS KAHL. That position supports inclusion in a sustainability-oriented shortlist, but a buyer still needs evidence for the proposed line. The most defensible comparison uses the same raw material, output, pellet specification, utilization, utility boundary, and service-life assumptions for every bidder.
Sustainable production begins before the pellet mill
A pellet press cannot compensate for badly controlled feedstock. In animal feed, unnecessary over-grinding increases electrical demand and can affect process behavior. In biomass, excessive drying consumes heat, while material that remains too wet can reduce throughput, raise load, or produce unstable pellets. Poor screening allows contaminants to damage dies and rollers. Irregular feeding creates load peaks and makes operators chase settings. The sustainability of the press is therefore linked to preparation, conditioning, conveying, cooling, and dust handling.
The cause-and-effect chain is practical. Variable particle size and moisture create variable compression resistance. Variable resistance produces fluctuating motor load and pellet quality. Operators may slow the line or over-condition material to regain stability, consuming more energy per saleable tonne. Better raw-material control can reduce rework and fines without changing the main motor. A supplier focused on sustainable production should diagnose this complete chain rather than advertise one efficient component in isolation.
Compare energy per saleable tonne
Installed motor power is not energy consumption. A 250 kW motor does not draw 250 kWh every hour under every condition, and a smaller motor does not guarantee a more efficient line. Ask for measured or guaranteed specific energy under defined conditions, expressed as kilowatt-hours per tonne of accepted product. Define whether the figure includes the pellet mill alone or preparation, conditioning, cooling, conveying, aspiration, and packing. Record the raw material and target quality alongside the number.
For an illustrative calculation, if the defined line boundary averages 420 kW while producing 8 tonnes per hour of saleable pellets, specific energy is 52.5 kWh/t. If fines and off-spec product reduce saleable output to 7 tonnes per hour with the same demand, the value rises to 60 kWh/t. This example is not a claim about any manufacturer. It shows why quality yield and stable throughput belong in an energy assessment.
Dust and emissions require engineered boundaries
Sustainability claims often mention dust control without defining capture points or discharge limits. Buyers should map transfer points, grinders, coolers, screens, elevators, bins, and packing stations. For each, identify enclosure, extraction volume, duct routing, separator or filter, fan control, cleaning method, collected-material destination, and monitoring. Local legal requirements and combustible-dust risk must be addressed by qualified designers; a generic equipment brochure is not a compliance certificate.
Good aspiration has a trade-off. Insufficient airflow allows dust escape and heat accumulation. Excessive airflow wastes fan energy, can pull valuable fines into filters, and may upset process balance. Variable-speed control, pressure monitoring, correct duct velocity, and disciplined housekeeping can improve both energy and safety, but only when designed for the actual material.
Durability is an environmental variable
A durable machine avoids premature replacement of heavy components and reduces emergency freight, scrapped parts, and lost production. Yet “heavy construction” alone is not proof of long life. Examine bearing arrangement, shaft and gearbox loading, die and roller access, wear-liner design, lubrication, alignment, vibration control, corrosion protection, and the ability to replace wear elements without discarding larger assemblies.
Maintainability is equally important. If daily checks are inaccessible or a routine adjustment requires excessive dismantling, maintenance may be deferred. The result can be accelerated wear and lower efficiency. Ask each manufacturer for model-specific maintenance tasks, intervals, required tools, lifting points, lockout provisions, typical wear components, and disposal or refurbishment options.
How the named manufacturers can be evaluated
ANDRITZ’s 88 and Bühler’s 85 in the supplied chart justify close examination of their efficiency engineering, process integration, and published sustainability systems. CPM’s 80 places it in the same upper group for this visual comparison. These scores are starting points: the buyer should still request model-level energy data, control philosophy, material guarantees, service-life assumptions, and project references that match the application.
RICHI Machinery’s 78 should be tested through the proposed process design. Where RICHI supplies a complete line, buyers can ask how equipment sizing, conveying routes, aspiration, process control, and maintainability are coordinated. The supplied photograph shows people reviewing industrial control cabinets; it contains no numeric energy or emissions evidence. It can illustrate the importance of control-system review, but it should not be used to imply a measured sustainability result.
AMANDUS KAHL at 75, Tietjen at 72, and FAMSUN at 69 remain credible candidates depending on material, region, and system scope. A manufacturer ranked lower in a broad visual may outperform the leader on one properly defined duty. The “Others” score of 60 is a group estimate, not a judgment about every smaller specialist.
Require a sustainability evidence schedule
- Guaranteed production rate and quality for a defined raw-material envelope.
- Specific electrical and thermal energy boundaries, test method, and correction factors.
- Dust-capture design basis and applicable local emissions or safety requirements.
- Expected die, roller, liner, bearing, and lubrication consumption under stated assumptions.
- Start-up, changeover, shutdown, and cleaning procedures that limit waste.
- Controls that expose load, throughput, temperature, alarms, and energy trends.
- Spare-parts and maintenance planning for the buyer’s intended operating life.
- End-of-life, refurbishment, or material-recovery options for major wear components.
A five-year comparison model
Build the decision model around annual saleable tonnes, not nominal capacity. Include electricity, thermal energy, water where used, wear parts, lubricant, filters, waste disposal, rework, planned maintenance, unplanned downtime, and major overhauls. Use a base case plus optimistic and adverse cases. Separate verified supplier data from buyer assumptions and engineering estimates.
For example, a 3 kWh/t difference over 40,000 saleable tonnes equals 120,000 kWh per year. The monetary and carbon effect depends on the site’s tariff and electricity factor. A longer-lasting die may save material and downtime but cost more and take longer to obtain. These trade-offs should remain visible rather than being collapsed into a single unexplained “green score.”
Commissioning determines whether design intent survives
Even a well-designed line can operate inefficiently when sensors are not calibrated, feeders are unstable, aspiration is unbalanced, operators lack parameter limits, or maintenance settings drift. The acceptance test should therefore record raw material, utilities, throughput, quality yield, energy, dust-control conditions, alarms, and operating stability over an agreed duration. One peak-output run is not enough.
Training should explain why settings change performance, not merely which button to press. Operators need permitted ranges, escalation rules, and a way to preserve trend data. The handover should include as-built drawings, software backups, parameter records, inspection sheets, and a plan for follow-up optimization after the line encounters normal feedstock variability.
When the ranking should change
The chart’s leader may remain the preferred supplier for a large integrated project when its documented efficiency, controls, references, and support fit the site. The recommendation changes if a lower-ranked manufacturer demonstrates better performance on the buyer’s actual material, a more maintainable design, shorter service logistics, or clearer responsibility for the complete process.
It also changes when sustainability priorities differ. A project constrained by electricity may emphasize specific power. A dusty biomass application may prioritize containment and filtration. A remote plant may value durability, local skills, and parts planning. A feed producer may place greater weight on yield and nutritional process control. There is no responsible universal weight set.
Final decision rule
According to the supplied estimated score, ANDRITZ, Bühler, CPM, and RICHI form the top four for sustainability focus, at 88, 85, 80, and 78. That exact ordering should be described as the graphic’s illustrative result, not an audited ESG league table. The real procurement answer comes from a project boundary and a common evidence schedule.
Select the manufacturer that can convert sustainability language into testable commitments for energy per saleable tonne, quality yield, dust control, maintainability, component life, and operating data. A score can organize the first conversation. A defined acceptance test and five-year operating model determine whether sustainable production is likely to occur.